Brian Leo
2014-10-13 00:25:21 UTC
Hello,
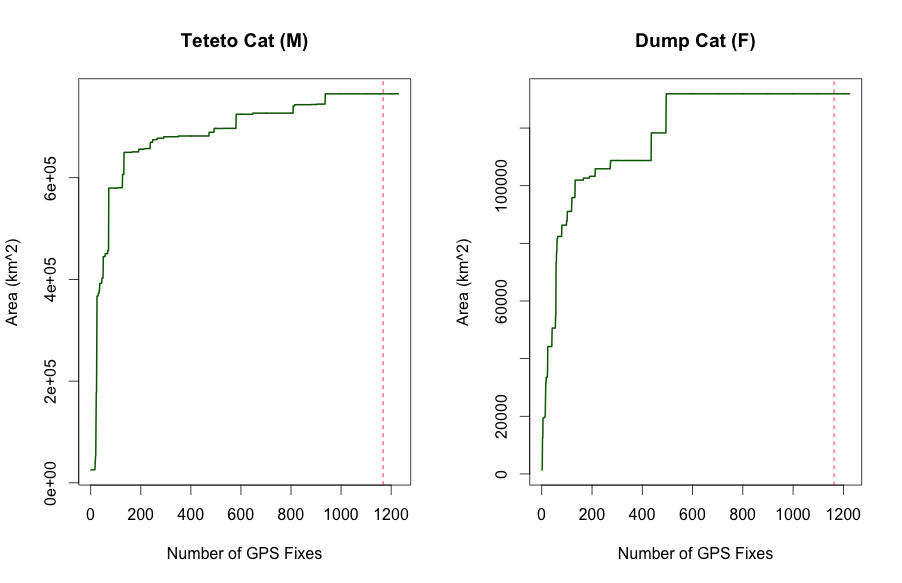
I am a stats novice and I was wondering what kind of model would work best
with the two datasets that are displayed. The graphs show an incremental
area analysis for two feral cat home ranges where area increases with
increasing number of GPS fixes.
Thanks,
Brian
--
Brian Leo
School of Aquatic and Fishery Sciences
University of Washington
1122 Boat St NE
Box 355020
Seattle, WA 98195
-------------- next part --------------
A non-text attachment was scrubbed...
Name: Rplot.png
Type: image/png
Size: 46519 bytes
Desc: not available
URL: <Loading Image... >
>
I am a stats novice and I was wondering what kind of model would work best
with the two datasets that are displayed. The graphs show an incremental
area analysis for two feral cat home ranges where area increases with
increasing number of GPS fixes.
Thanks,
Brian
--
Brian Leo
School of Aquatic and Fishery Sciences
University of Washington
1122 Boat St NE
Box 355020
Seattle, WA 98195
-------------- next part --------------
A non-text attachment was scrubbed...
Name: Rplot.png
Type: image/png
Size: 46519 bytes
Desc: not available
URL: <Loading Image...
 >
>